Today we published a paper which builds on our ideas about equigenic environments – places that can reduce health inequalities – and continues the investigation of associations between nature and health. This new study builds on a paper CRESH’s Rich Mitchell published a long time ago (2008) with Dr Frank Popham, suggesting that populations which have more green space in their neighbourhood tend also to have a smaller health gap between richer and poorer residents. Other people have found something similar (see this for example, or this). The idea that ‘equigenic’ environments might be able to disrupt the usual conversion of inequalities in wealth to inequalities in health has gained attention, partly because it seems so difficult to do anything about the health gap that almost inevitably follows a wealth gap, and partly because politicians and society seem unwilling to tackle the wealth gap itself. (more…)
Category: Inequalities
-
Is multiple environmental deprivation related to population health in Portugal?
In our recently published paper (open access version here) we describe the development of a multivariate measure of physical environmental deprivation for the 278 municipalities of Portugal, and demonstrate its strong relationship with mortality rates. (more…)
-
Mapping life expectancy in Scottish Parliamentary Constituencies
By Helena Tunstall, Elizabeth Richardson & Jamie Pearce
New life expectancy at birth figures for 2011-2013 for Scottish Parliamentary Constituencies have just been released by National Records of Scotland (NRS). We’ve mapped and graphed these data to illustrate the latest geographical patterns of mortality in Scotland. (more…)
-
‘An environment where young people choose not to smoke’ is not one where tobacco products are sold on every street corner
By Niamh Shortt
Teenagers are more likely to smoke if they live in areas with the highest number of tobacco retailers. Our paper led by Niamh Shortt, published today in Tobacco Control, examined the relationship between tobacco outlet density and smoking habits of 13 and 15 year olds in Scotland. (more…)
-
Watch CRESH seminar on YouTube: Why is urban health so unequal?
Why is urban health so unequal?
CRESH member Prof Jamie Pearce recently contributed to an event jointly organised by the Global Environment and Society Academy (GESA) and the Global Health Academy to deliver a public seminar series exploring the complex relationships between environment and health. The seminar series marks The Year of Environment and Health and will examine key issues such as urbanisation, population growth, extreme weather, pollution and ecosystem services through the lens of global environmental change. You can watch the public lecture here:
-
Social differences in pollution across the EU may help to explain health inequalities
As a European Commission report and an important academic paper have recently reminded us, air pollution remains a persistent threat to population health across Europe. Pollutants such as particulate matter and ozone are among the leading causes of premature mortality and respiratory-related health outcomes. Globally, exposure to air pollution ranks as one of the top ten risk factors for health. (more…)
-
Life expectancy changes in European regions over two decades: have the gaps narrowed or widened?
In CRESH’s latest publication, in the European Journal of Public Health, we look at health inequalities across Europe from a geographical perspective: tracking how life expectancy changed between 1991 and 2008 within 129 regions of 13 countries (combined population 272 million in 2008). Across this period life expectancies improved in every region (see maps below). But we find no evidence that geographical inequalities narrowed during this time, despite efforts to reduce the gap. In Eastern European regions the life expectancy gap for males actually widened. We then investigate whether the inequalities could be “explained” by socioeconomic disparities between the regions – measured as regional-average household income (in comparable units). We find that household income differences could partly explain the life expectancy gaps, although not for female Eastern Europeans. (more…)
-
Is Japan really an exemplar of income equality? Comparing Japan with the UK
Since the development of the ‘income inequality hypothesis’, brought to broad attention by the publication of Richard Wilkinson and Kate Pickett’s book “The Spirit Level” (2009), Japan has commonly been held up as an exemplar of the benefits of low income inequality for health and social wellbeing. In contrast, the UK has been represented as an example of the high rates of social problems and poor population health that result from greater income inequality.
The ‘income inequality hypothesis’ has been the subject of intense scrutiny in academic journals for several decades and, following the public and political prominence of “The Spirit Level”, in the UK media and in reports from right of centre think tanks. Less well known in the UK, are the increasing concerns of some Japanese researchers that Japan is no longer the exemplar of income equality it is now often perceived to be.
The common self-perception among the Japanese of their country as an egalitarian ‘90 per cent middle-class society’ was first strongly challenged by Japanese economist Toshiaki Tachibanaki’s book “Confronting Income Inequality” published in Japan in 1998. Since then analysis by Japanese researchers has focussed attention on the problems of poverty in Japan. More recent data from different sources has produced markedly varied pictures of the degree of income inequality in Japan. Data presented in ‘”The Spirit Level” (2009) from the United Nations Development Programme Human Development Indicators suggests that Japan has the lowest levels of income inequality out of the group of the 21 rich countries compared. However, OECD figures published in 2011 have suggested that Japan has higher than average income inequality compared to other OECD countries.
The UK has relatively high levels of income inequality compared to other developed countries in recent data regardless of source.
A newly published paper, by Dimitris Ballas and colleagues Danny Dorling, Tomoki Nakaya, Kazumasa Hanaoka and Helena Tunstall, has analysed patterns of income inequality in Japan and the UK to try to establish a better picture of patterns and trends in income distribution within these two countries.
A key point about income microdata in Japan is that there is not much of it. Japan has just two surveys with suitable income data for calculating income inequality. The National Survey of Family Income and Expenditure (NSFIE) has been used by the World Bank in its income inequality figures. The other available survey, The Comprehensive Survey of Living Conditions (CSLC), was the data source for income figures in Tachibanaki (1998) and the more recent work of the OECD.
Differences between these surveys may be the first major factor underlying conflicting estimates of income inequality in Japan. It has been suggested that the CLSC may over-sample low income households while the proportion in NSFIE may be relatively small in comparison with other nationally representative data collected by the Statistics Bureau of Japan. We used the NSFIE as this was available over a longer period for years that were more suitable for comparison with available UK data.
The UK is fortunate to have a broad range of social surveys containing individual and household income data. We selected UK income data from the Family Resources Survey (FRS) and Households Below Average Income (HBAI) survey for use in our study.
We calculated two forms of inequality: mean and median income ratios. The median quintile ratio is the median income of the richest 20 per cent of the population divided by the median income of the poorest 20 per cent and is used in the analyses of HBAI data sets conducted by the Department for Work and Pensions in the UK. The mean quintile ratio is the mean income of the richest 20 per cent of the population divided by the mean income of the poorest 20 per cent and is the measure presented in “The Spirit Level”.
The results of our analysis of gross income find that in the three years for which we had comparative data, 1994, 1999 and 2004, the median quintile ratios in Japan were 3.85, 4.08 and 3.99 respectively, while in the UK the equivalent figures were 5.09, 5.23 and 4.99. The mean quintiles ratios in Japan were 4.56, 4.74 and 4.67 and in the UK were 6.65, 7.13 and 6.93 respectively.
So, in our data in all years both median and mean quintile ratios indicated significantly higher income inequality in UK than Japan. There was no clear time trend in income inequality in either country with ratios in both countries greatest in the mid time period 1999. The difference in degree of income inequality between Japan and UK was larger in the mean than median quintile ratios.
Understanding which measure of inequality has been used in international comparisons of income inequality is crucial as it is likely to be the second major source of discrepancy between estimates of income inequality in Japan from different sources. The reasons for this are indicated by analysis we completed of gross income distributions in Japan and UK across the full range of incomes. This found that compared to the UK, Japan actually has greater proportions of its population in the very lowest household income bands. This supports recent concern regarding poverty in Japan. However, we also found the proportions of the Japanese population in high income households, especially at the very highest levels of income are lower than those in UK. These results are consistent with previous research suggesting the share of total income held by the top groups is much lower in Japan than the UK and USA.
The relatively low levels of income among the highest income groups in Japan will have a greater impact on its mean than median top quintile figures and different implications again for figures based on the Gini coefficient. Recent international comparisons published by the OECD in 2011 suggesting relatively high levels of income inequality in Japan, unlike our study, used income data from CSLC and the Gini coefficient to measure income inequality. The Gini coefficient is likely to be less sensitive to the unusual income patterns among the highest income groups in Japan than either the mean or median income quintile ratios, which are both based on comparisons of the highest and lowest income quintiles only.
The limitations of available income data mean that disagreements about the measurement of income inequality are likely to continue to contribute to controversy regarding inequality in Japan, UK and beyond. But, this analysis provides further evidence that Japan is an exemplar of a particular type of income distribution, it is a country with considerable poverty but in which higher incomes have been checked to an unusual degree. These results reaffirm the significance of Japan to debates about the income inequality hypothesis and emphasise the importance of assessing the potential social harms resulting from very high incomes.
Author Helena Tunstall
-
What if neighbouring areas are very different?
Waldo Tobler’s first law of geography is that “everything is related to everything else, but near things are more related than distant things.” This is an important idea for many aspects of spatial science, but it’s taken particularly seriously by people who draw maps and do statistics to investigate how and why disease rates vary from place to place.
If Tobler’s first law holds, we should expect the characteristics of people and places who are close together (including their health) to be similar. So, in general, the folk who live in your neighbourhood should be more like you than the folk who live on the other side of town.
This matters when we are researching if and how environment affects health. We know that people’s health can be affected by a huge range of things. If we are to reveal the health impacts that environment has, we need to try and allow for as many of those other influences as possible. However, we know that it’s very hard to account for all of them. This means some of the relationship between environment and health we see in our analyses may actually be due to these ‘unmeasured’ influences, a problem we call ‘residual confounding’. Now, if Tobler’s law is right, it is also likely that these unmeasured influences are also more similar when they are closer together. When this happens, it’s called residual spatial confounding. If we don’t allow for it, we run the risk of making mistakes in assessing the strength of relationships between the characteristics of environments and the health of the people who live there.
The good news is that these problems have long been known about and there are a range of techniques to try and deal with them. They include ways to statistically ‘smooth’ maps showing how risk of a disease varies from area to area, and to adjust measurements of risk for how close together they are in geographic space.
The bad news is that Tobler’s first law is not always true! It’s not always the case that neighbouring areas do have similar characteristics or environments. Often areas that are right next to each other contain very different types of people and have a very different environment. You have probably experienced this when walking around a town or city. You cross a road, the housing changes dramatically, and the streets ‘feel’ different. Those statistical techniques assume that kind of sudden change doesn’t happen.
Dr Duncan Lee and Prof Rich Mitchell have just finished an ESRC funded research project (RES-000-22-4256) trying to improve the way we handle this situation in our research. We have successfully created, and published techniques that can spot when two neighbourhood areas are so different that we need to alter our statistical assessment of the relationships between health and environment. One technique, published in Biostatistics, can be used when we have data that tell us something about the characteristics of the people or the neighbourhoods, such as house prices or smoking rates. The other can be used when all we have is information about health in the areas (now in press with Journal of the Royal Statistical Society Series C) .
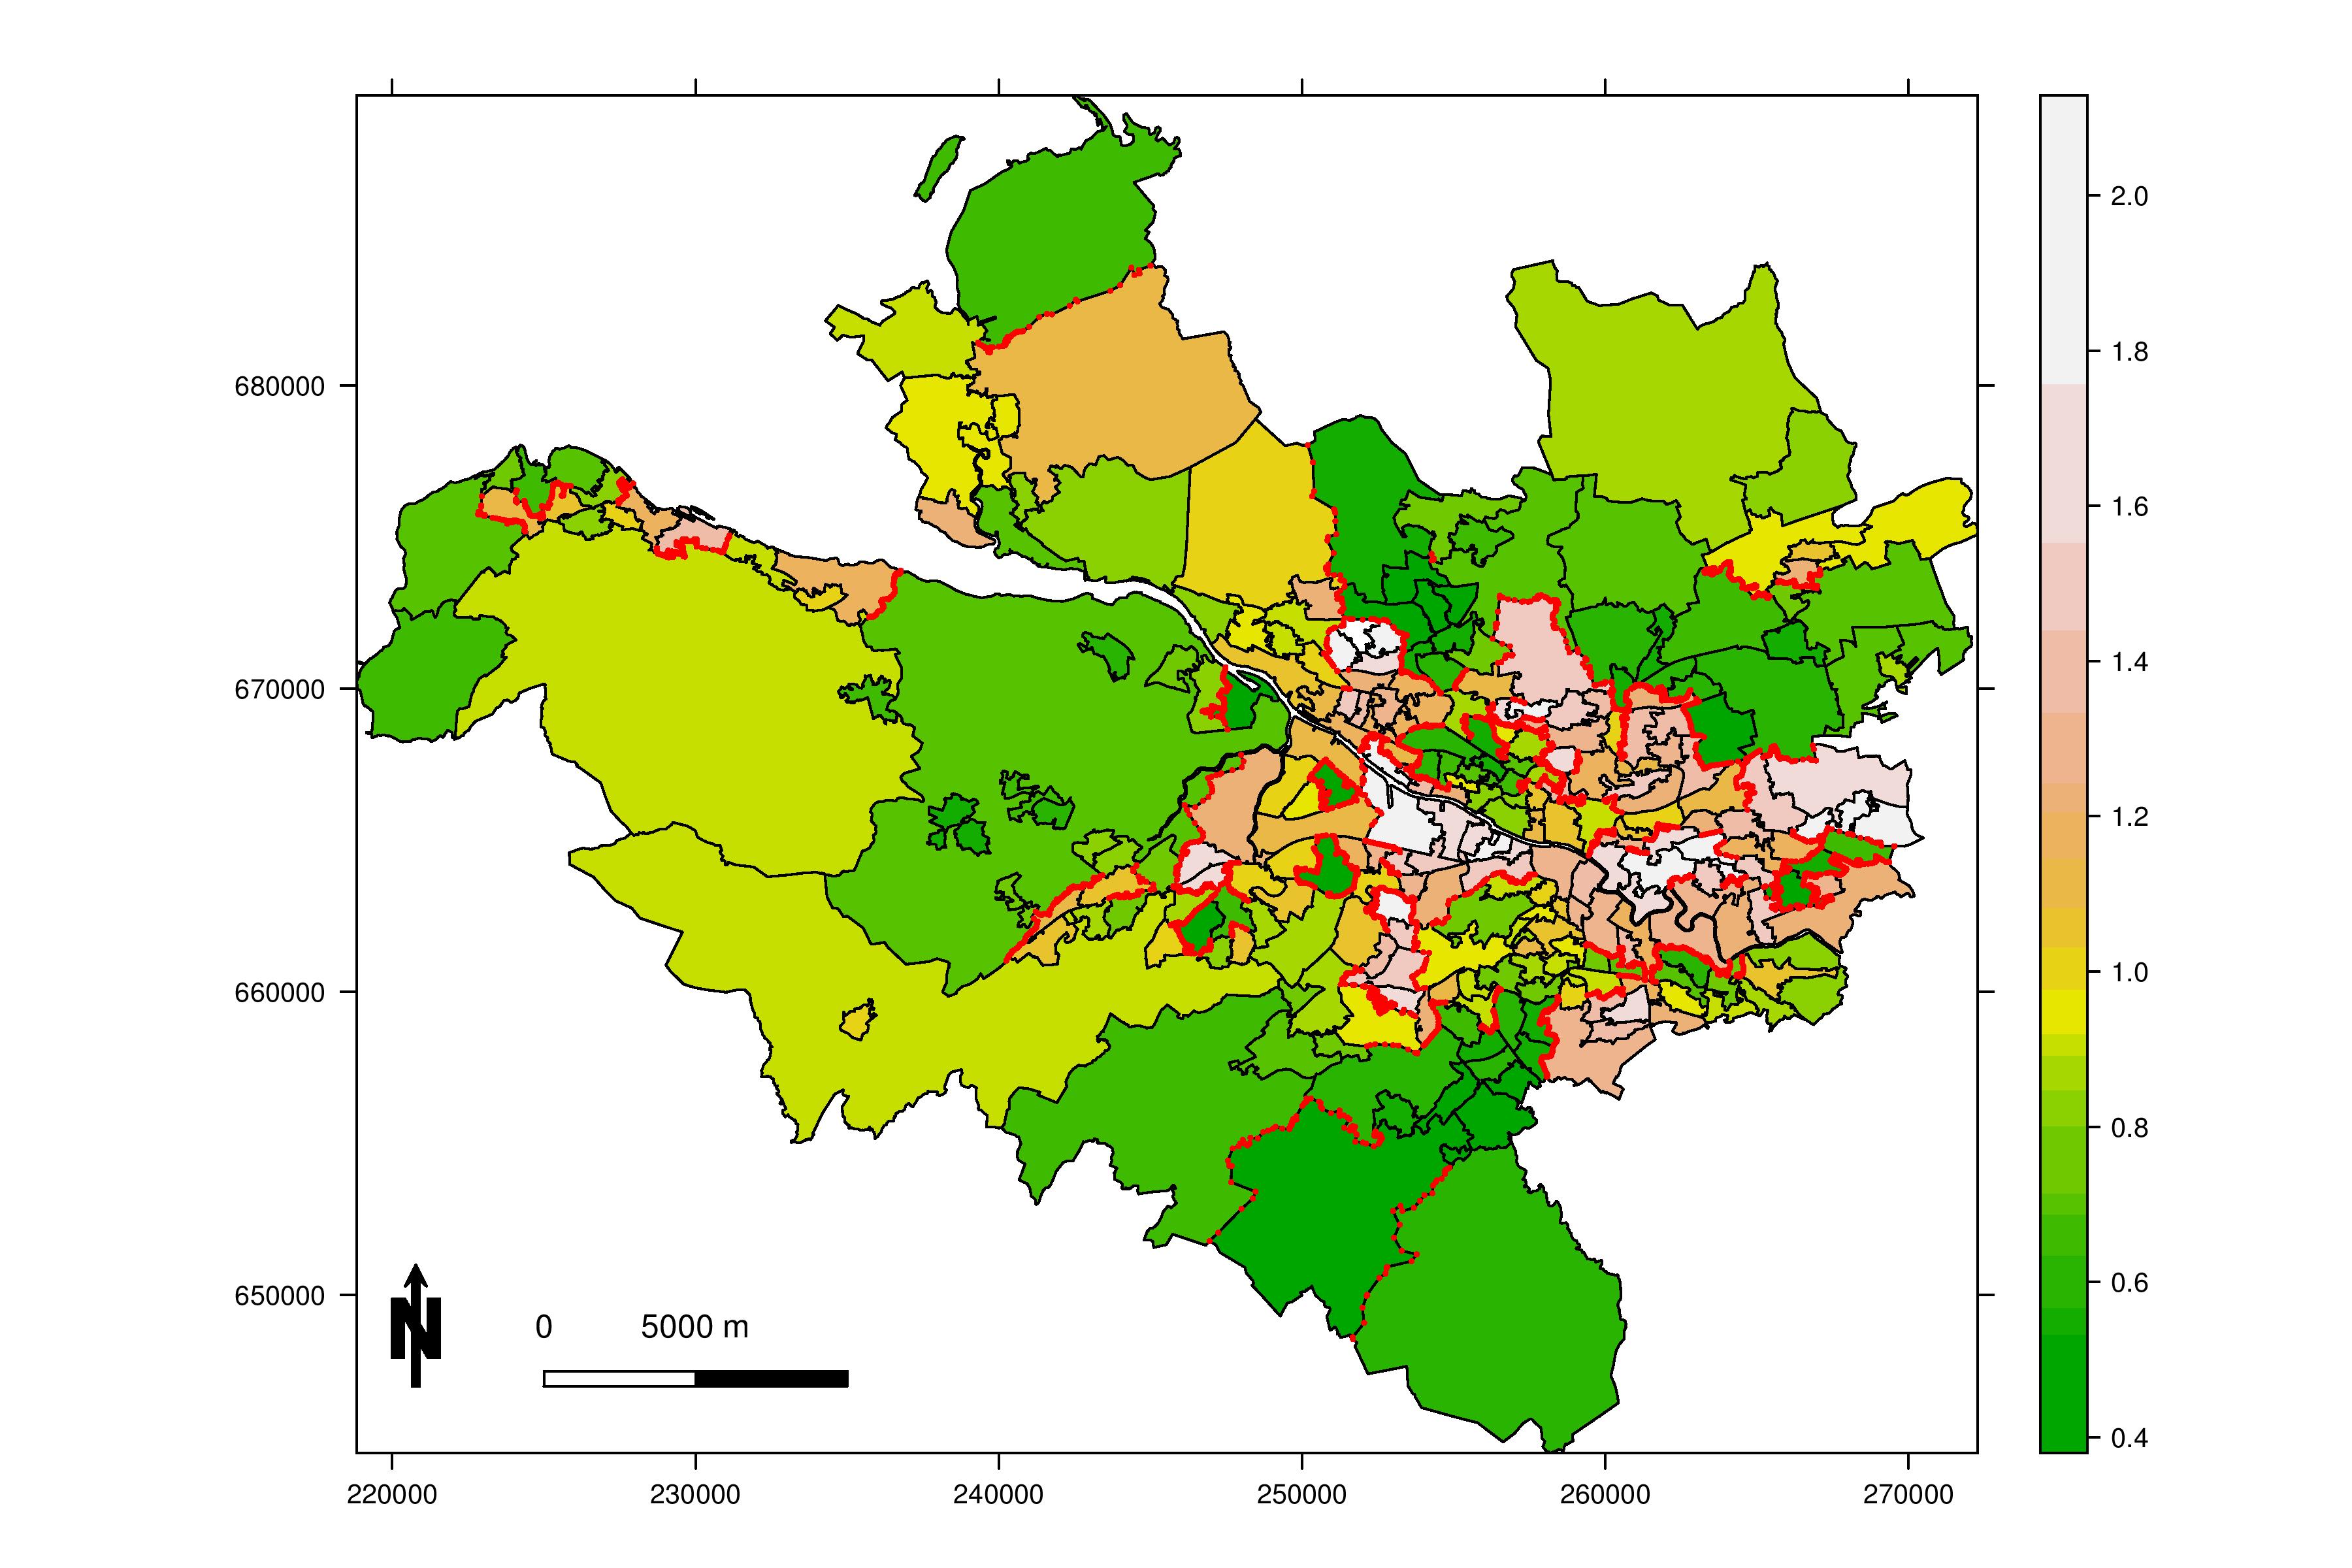
Here’s an example of our results. The map below (click it to view full size) shows 271 areas that make up the Greater Glasgow and Clyde Health Board (for the geeks, the areas are intermediate geography zones). We obtained data on the risk of admission to hospital with a primary diagnosis of respiratory disease, from the Scottish Neighbourhood Statistics database (http://www.sns.gov.uk/). The map is shaded so the colour of each area denotes its disease risk, with a value of 1.0 representing an average risk across the whole health board. Values above 1.0 represent high risk areas (for example a value of 1.10 indicates a 10% higher risk), while values below 1.0 represent low risk areas (for example a value of 0.85 indicates a 15% reduced risk). The red lines show boundaries between neighbouring areas that contain populations at very different risk of hospital admission for respiratory disease. These are the areas in which the conventional techniques would make mistakes. There are 173 of them… that’s 25% of all the boundaries in the map.

Data and boundaries © Crown Copyright. All rights reserved 2010.
We have created a free software package that will allow anyone to apply our techniques. It’s called CARBayes and is for the statistical software R. You can read about it and get it from here.
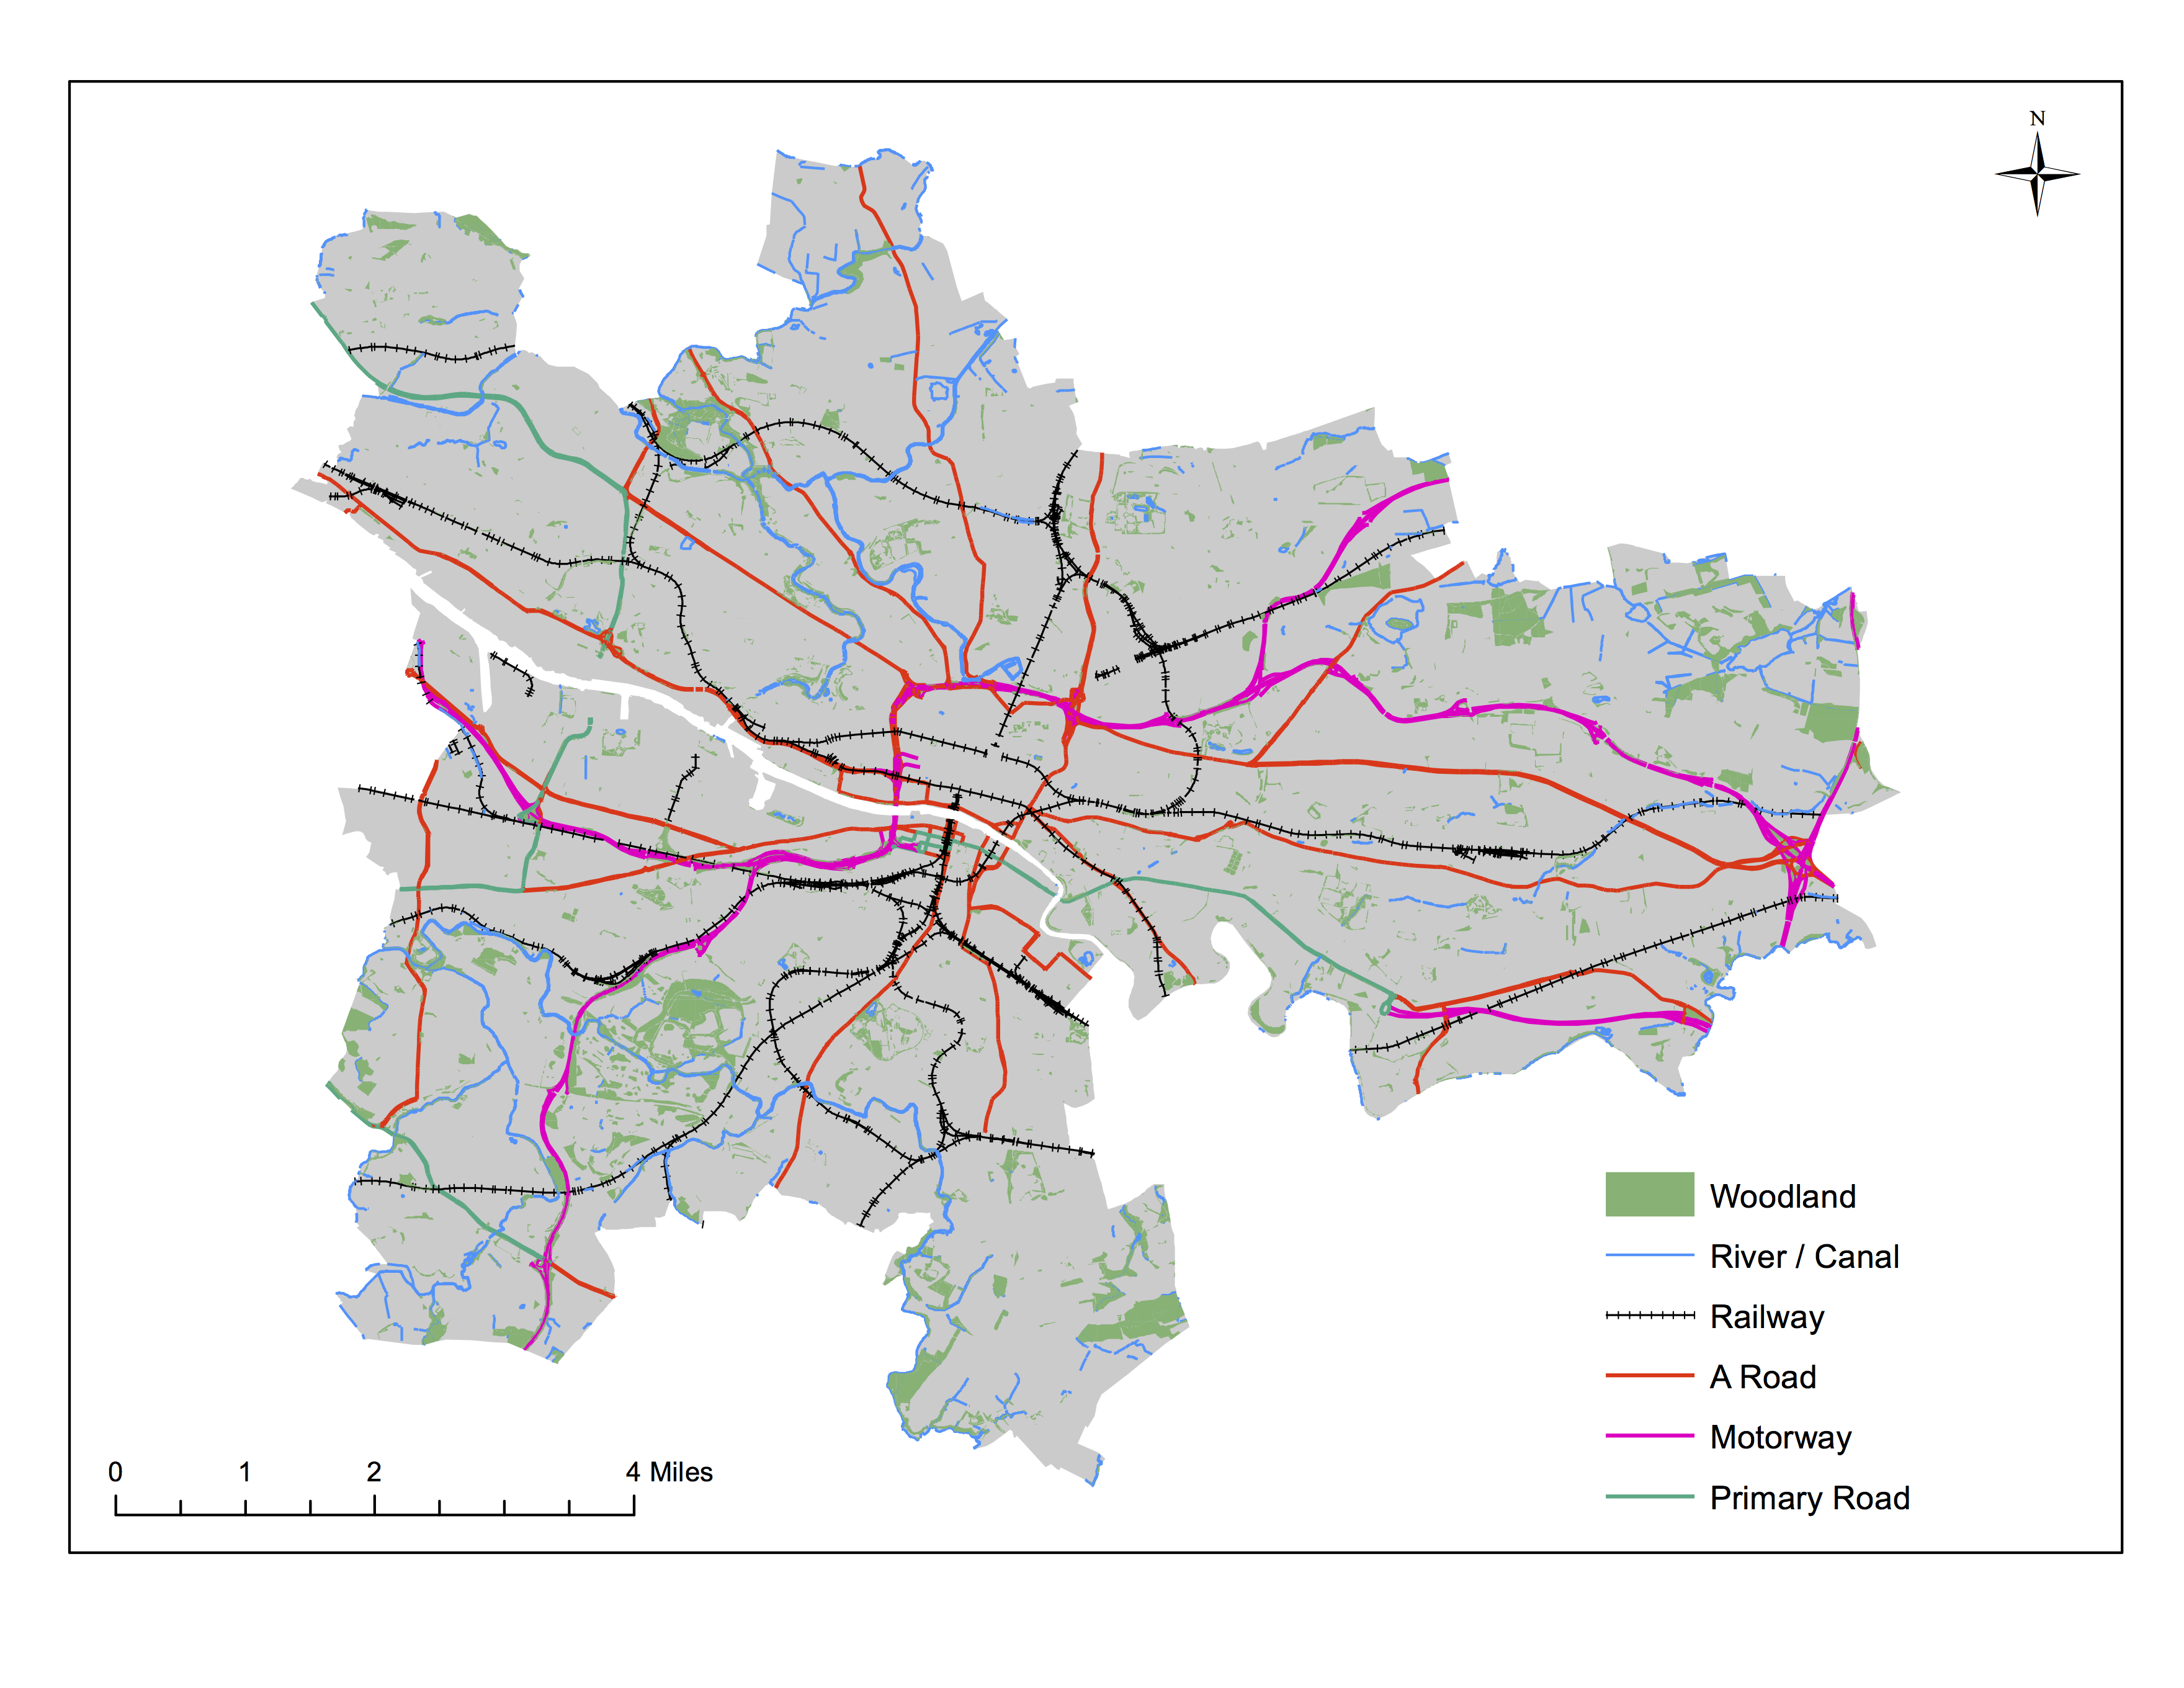
There has also been an interesting spin off from this research. Within Glasgow, we found a lot of neighbourhoods that were right next to each other but were very different in social and economic terms. We called these between-neighbourhood differences ‘social cliffs’. It prompted us to ask how such social cliffs occur. One idea is that they may be made more likely by physical barriers between the neighbourhoods, such as rivers, main roads or railways.The map below (click it to view full size) shows the kinds of physical features we’ve been looking at (note, our data are for the period before the new M74 motorway was opened).

Map based on data that are © Crown Copyright/database right 2012. An Ordnance Survey/EDINA supplied service.
Our research is now complete and we’re writing it up for publication. It seems that two kinds of physical feature are especially important. Where one or both of them lie along a neighbourhood boundary, it’s much more likely that the neighbourhoods will be very different socially, and economically. Which two do you think they are?
-
New review shows socio-economic position over the life course affects quality of life
A new systematic review looking at the relationship between socio-economic position over the life course and quality of life has just been published in BMC Public Health by CRESH PhD student Claire Niedzwiedz, Rich Mitchell and colleagues at the University of Glasgow and MRC/CSO Social and Public Health Sciences Unit.
The review’s aim was to gather and examine evidence about how people’s quality of life as adults depends on the social and economic circumstances they have experienced throughout their life, from childhood onwards. Do childhood circumstances matter? Does it help if people move ‘up’ the socio-economic ladder? Does it harm if people move ‘down’?
In chronic disease epidemiology, several conceptual models have been developed to help explore these ideas and they provide a foundation for investigating life course effects. The accumulation model hypothesises that adverse socio-economic experiences have a cumulative, dose–response effect on health. The latent model (or critical period) suggests that circumstances during childhood have an effect on health, over and above adult circumstances. Pathway models emphasise the importance of trajectories across the life course. Social mobility models are usually divided into intra-generational and inter- generational where inter-generational mobility refers to a change in social class between generations and intra-generational mobility is the movement between different social classes in adulthood. The mobility models suggest that change in your socio-economic position will affect health, and in general lead us to expect that movement ‘up’ the social ladder is good for health, but movement down may be bad.
The review identified 12 relevant articles which used data from different five countries.
The evidence supported an overall relationship between socio-economic position over the life course and quality of life but results for each life course model were mixed. There was some evidence to suggest a latent effect of childhood socio-economic position on later quality of life for women, but the effect was not found for men. Overall, results for social mobility models suggested little effect. We found very few studies that actually assessed inter-generational mobility or accumulation and pathway effects.
There was a very wide range socio-economic position measures, outcomes, analytic techniques, reference populations and quality across all the studies we looked at. This led to a key message from the review; the need to increase study comparability. A second key message was the need for comparable data and studies from different countries. This may help to uncover aspects of different societies that influence the relationship between socio-economic position over the life course and quality of life.
You can access the article here: http://dx.doi.org/10.1186/1471-2458-12-628.